
Visualizing normal subgroups in S4
09 Nov 2018The Math Lab at the University of Kentucky has a group which visualizes mathematical ideas through quilting, with projects involving partitions, hyperbolic tilings, and prime sieves. One idea for a quilting project, originally suggested by Dave Jensen, was to create a quilt representing the Cayley table for the symmetric group \(S_4\) to exhibit its flag of normal subgroups. This post describes implementation of that idea using Mathematica.
The symmetric group \(S_4\) is the group of bijective functions from the set \(\lbrace 1,2,3,4 \rbrace\) to itself. It has an index \(2\) normal subgroup \(A_4\), consisting of only the even permutations, and contained inside \(A_4\) is the Klein \(4\)-group \(V\), generated by all products of disjoint \(2\)-cycles. \(V\) is also normal is \(S_4\). Taken together this describes a flag of normal subgroups in \(S_4\)
\[ (1) \trianglelefteq V \trianglelefteq A_4 \trianglelefteq S_4\]
To work with these permutation groups in Mathematica, all we need to know is that \(S_n\) is generated by any \(2\)-cycle and any \(n\)-cycle, \(A_4\) is generated by \((123)\) and \((124)\), and \(V\) is generated by any two of its non-identity elements.
a = Cycles[{{1, 2}}];
b = Cycles[{{1, 2, 3, 4}}];
G = PermutationGroup[{a, b}];

c = Cycles[{{1, 2, 3}}];
d = Cycles[{{1, 2, 4}}];
A = PermutationGroup[{c, d}];

e = Cycles[{{1, 2}, {3, 4}}];
f = Cycles[{{1, 3}, {2, 4}}];
V = PermutationGroup[{e, f}];
The Cayley table of a group is just a multiplication table for the group operation. If we form a naive Cayley table for \(S_4\) using the default ordering of the elements given by Mathematica, and encoding the elements using a built-in color function, then we don’t expect to see much of the structure, but it’ll show us our starting point.
ArrayPlot[GroupMultiplicationTable[G],
 ColorFunction -> "ThermometerColors"]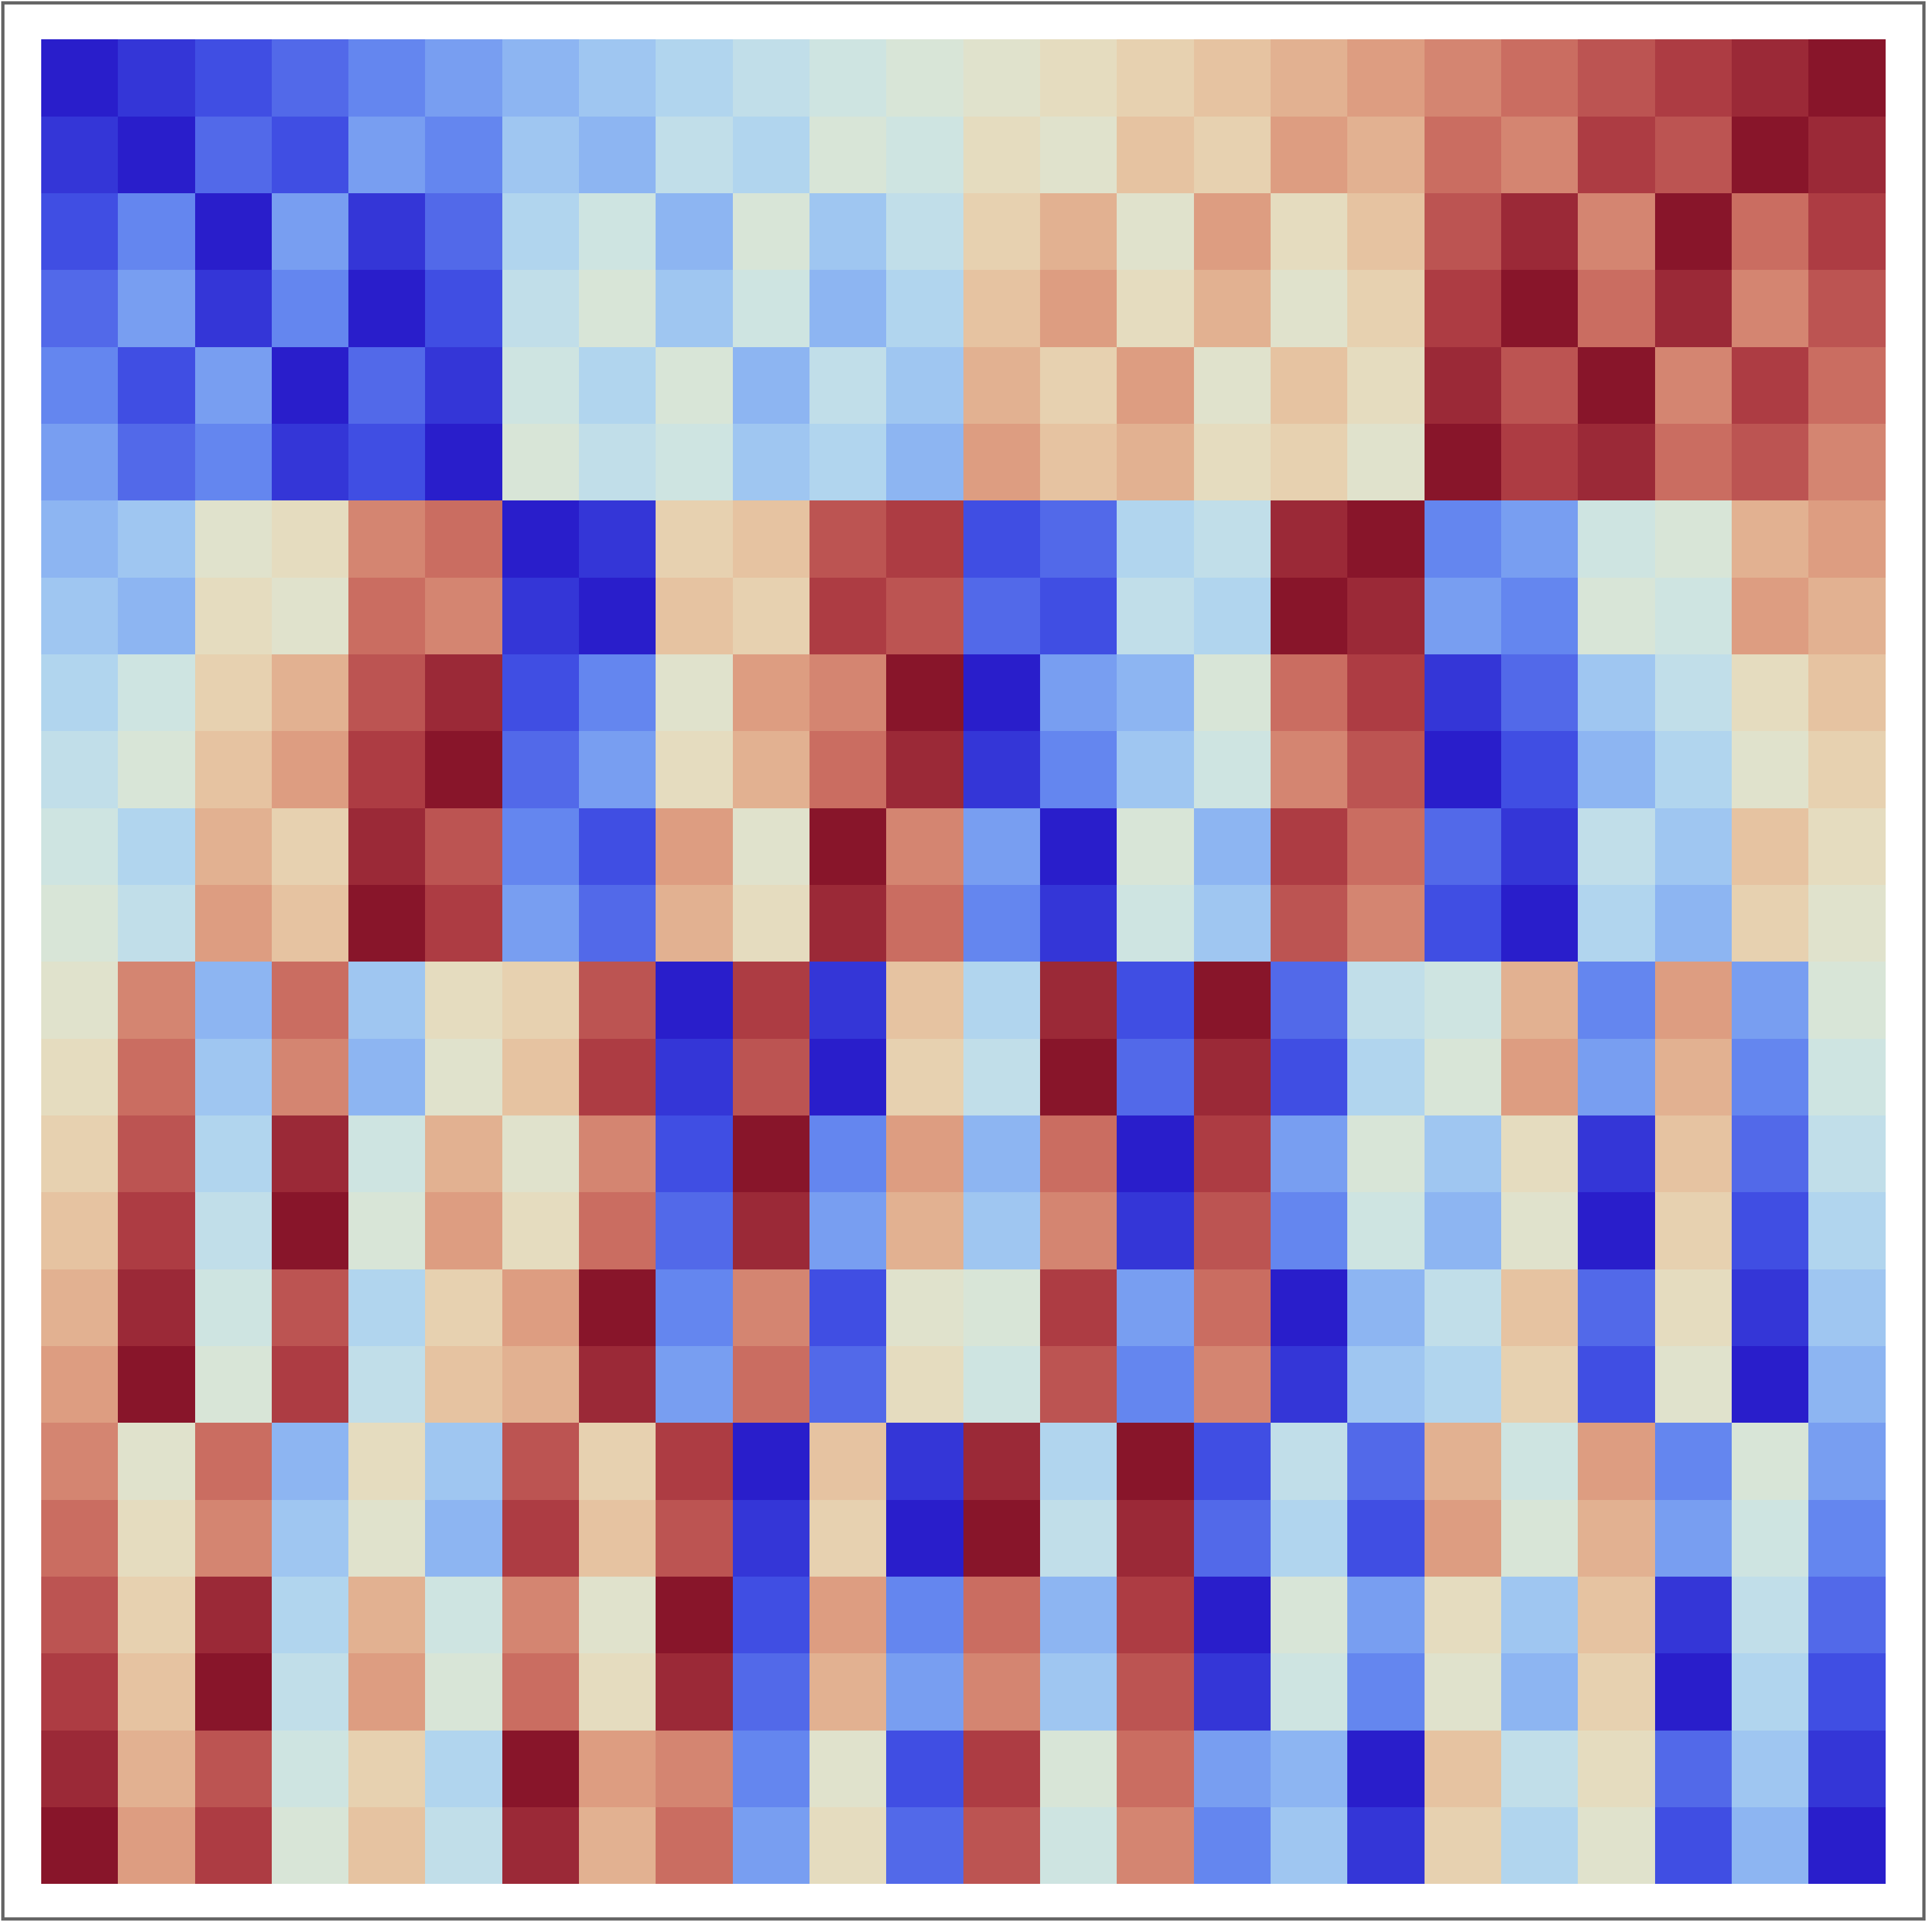
This Cayley table seems to have some structure, especially in the way that the top six rows look like they’re organized by color into squares. Explaining this takes a bit of additional effort to figure out exactly which elements of \(S_4\) have been assigned which colors. We generate a list of elements of \(S_4\), written in cycle notation and backed by their Mathematica-assigned color. Note that since the first element of \(S_4\) is the identity permutation, this is also a description of the topmost row and leftmost column in the Cayley table.
elements = GroupMultiplicationTable[G][[1]];

ArrayPlot[{elements} // Transpose,
 ColorFunction -> "ThermometerColors", AspectRatio -> 7,
 Epilog -> {
   MapIndexed[
    Text[Style[ToString[Flatten[Level[GroupElements[G][[#1]], 1], 1]],40],
    Reverse[#2 - 1/2]] &,
    Reverse[{elements} // Transpose], {2}]}]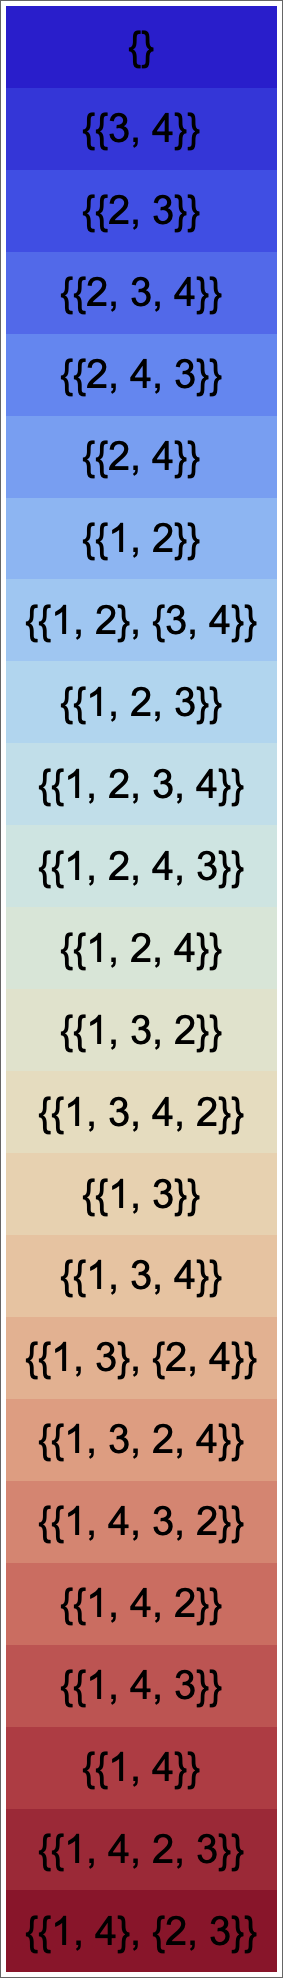
Note that for the built-in ordering of \(S_4\), the first six elements are the subgroup \(S_3 \leqslant S_4\) of permutations that fix \(1\). Since subgroups are closed under multiplication, this explains why the top-left \(6 \times 6\) square of the Cayley table only uses the first six colors from the above list. After staring a little longer, we can also note that the \(7^\text{th}\) through \(12^\text{th}\) elements are exactly the left coset \((12)S_3\), the \(13^\text{th}\) through \(18^\text{th}\) elements are exactly \((132)S_3\), and the last six elements form the last coset \((1432) S_3\). This explains why the first six rows of the Cayley table form what appear to be four distinct squares: The left cosets of \(S_3\) are fixed, but permuted internally, by right multiplication by an element of \(S_3\). Additionally, we observe that each column in the Cayley table seems to consist of four distinct strips: dark blue, light blue, dark red and light red, in some order and internally permuted. This is because left multiplication by an element of \(S_4\) permutes the left cosets of \(S_3\).
However, right multiplication does not preserve the left cosets of a subgroup, unless that subgroup happens to be a normal subgroup. This leads us to our process for making a Cayley table that represents the flag of normal subgroups. We want to re-order the elements of \(S_4\) so that the first four elements form the subgroup \(V\), and so the rest of the list is sorted into the five left cosets of \(V\). Furthermore, we want the first three cosets to comprise the elements of \(A_4\). This accomplishes a partition of the elements of \(S_4\) into the two cosets of \(A_4\), which are further subdivided into three cosets of \(V\) each.
Vreps =
  Table[RightCosetRepresentative[V, g], {g, GroupElements[G]}] //
   DeleteDuplicates;

(* rearrange them so the first three are in A_4 *)

VrepsSorted = (Select[Vreps, GroupElementQ[A, # ] &] // Sort)~
   Join~(Select[Vreps, ! GroupElementQ[A, # ] &] // Sort);

(* a list of indices giving the desired order*)

idx = Table[
     PermutationProduct[v, r], {r, VrepsSorted}, {v,
      GroupElements[V]}] // Flatten // GroupElementPosition[G, #] &;

(* The Cayley table, re-arranged accordingly *)
M = Table[
   GroupElementPosition[G,
    PermutationProduct[GroupElements[G][[idx[[i]]]],
     GroupElements[G][[idx[[j]]]]]], {i, 1, 24}, {j, 1, 24}];
The index list idx is itself a permutation, which tells us how
to re-order the elements of \(S_4\) for our purposes. Inspecting
idx we see:
{1, 8, 17, 24, 4, 13, 21, 12, 5, 20, 9, 16, 3,
14, 11, 22, 6, 19, 15, 10, 2, 7, 23, 18}
All that’s left to do is to come up with a color function meeting our specifications. We need to come up with six visually distinct colors \(c_1, \ldots, c_6\), and assign to the numbers \(1,8,17,24\) four different shades of \(c_1\), assign to the numbers \(4,13,21,12\) four different shades of \(c_2\), and so forth. This will distinguish the six cosets of \(V\). Additionally, we want to choose colors so that \(c_1, c_2,\) and \(c_3\) look similar to each other, as do the colors \(c_4, c_5\) and \(c_6\), but with some distinction between the two triplets to distinguish the cosets of \(A_4\).
These are just aesthetic choices, but we might choose some reds, oranges and yellows for the cosets of \(V\) in \(A_4\), and some blues and greens for the cosets of \(V\) that aren’t in \(A_4.\)
fourfades  = NestList[Lighter[#, 1/6] &, #, 3] &;

colorchoices = {
   RGBColor["#EF476F"],
   RGBColor["#F78C6B"],
   RGBColor["#FFD166"],
   RGBColor["#06D6A0"],
   RGBColor["#118AB2"],
   RGBColor["#073B4C"]};

colorlist = Map[fourfades, colorchoices] // Flatten;

sixcolors = Function[x, Blend[colorlist, x]];
Looking at our re-ordered list of elements of \(S_4\) with this new color palette, we see that it more or less accomplishes what we set out to accomplish.
ArrayPlot[({Range[24]} // Transpose)/24,
 ColorFunction -> sixcolors,
 AspectRatio -> 7,
 Epilog -> {MapIndexed[
    Text[
     Style[ToString[Flatten[Level[GroupElements[G][[idx]][[#1]], 1], 1]], 40],
     Reverse[#2 - 1/2]] &,
     Reverse[{Table[n, {n, 1, 24}]} // Transpose], {2}]}]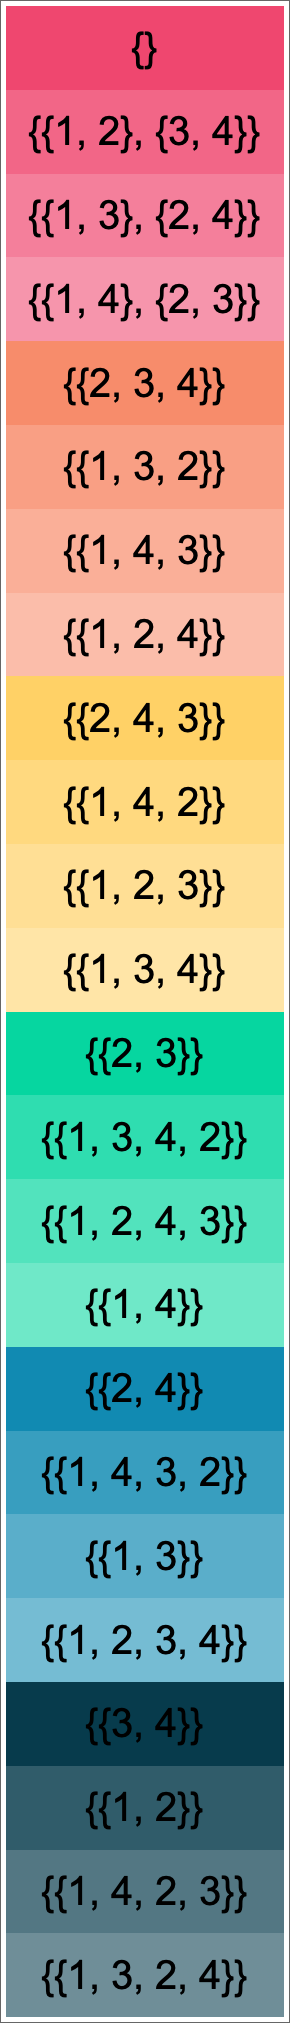
Finally, making a new Cayley table for \(S_4\) with this color palette and element re-ordering, we end up with this:
loc = Position[idx, #][[1]][[1]] &;

ArrayPlot[Map[loc, M, {2}]/24, ColorFunction -> sixcolors]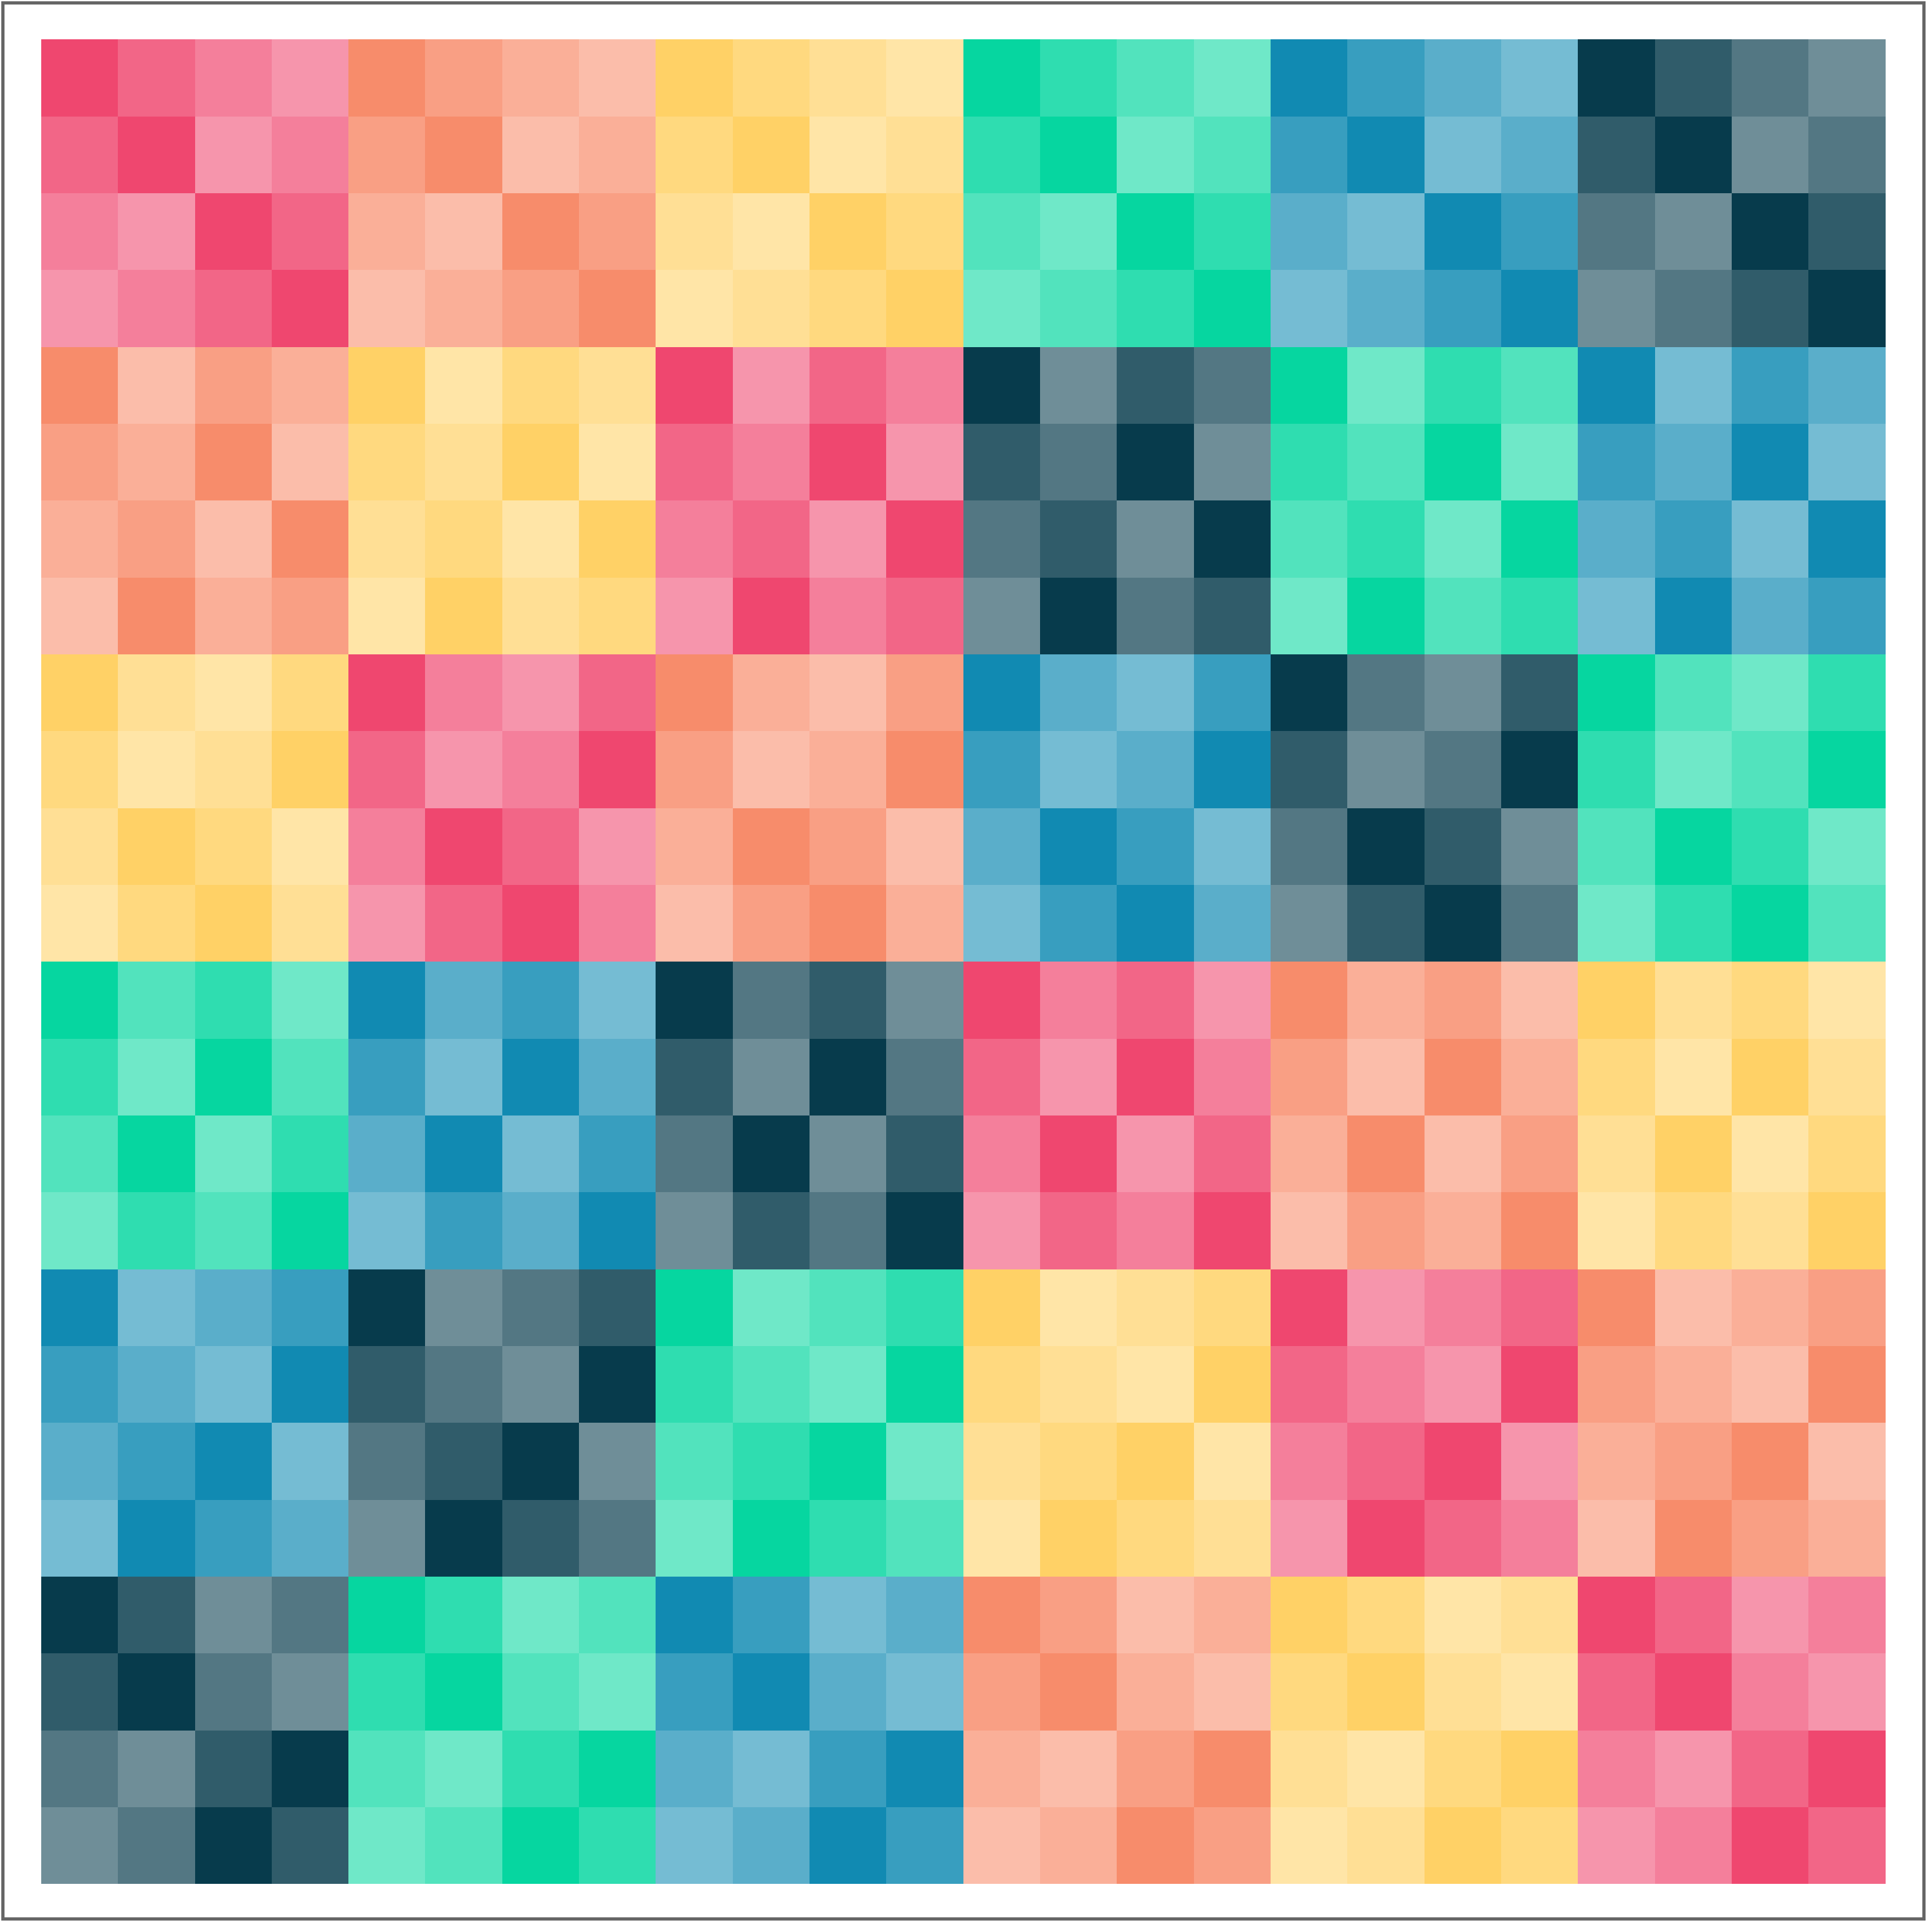
This Cayley table for \(S_4\) shows the flag of normal subgroup as we hoped it would. It’s still a multiplication table for the group \(S_4\), though with the elements listed in a different order. The top left \(12\times 12\) block is a Cayley table for \(A_4\), and the top left \(4 \times 4\) is a Cayley table for \(V\). Furthermore, the four \(12 \times 12\) blocks form a Cayley table of the quotient group \(S_4 / A_4\), while the thirty-six \(4 \times 4\) blocks are a Cayley table of \(A_4 / V\), and the nine \(4 \times 4\). blocks in the top left are a Cayley table for \(A_4 / V\).
Update (early 2020): The 2D visualization group in the UK math lab is working on a quilt based on this design, and they’re making fast progress. Their work might one day be displayed at mathematical art exhibit at the JMM, like their partitions quilt was this year.